How to Conduct a “Paper Towel Performance Test” (And Find the True Best Value)
A Paper Towel Performance Test is a data-driven, 3-phase diagnostic protocol that moves beyond marketing claims, allowing you to find the true best value by objectively scoring Absorbency, Strength, and Lint.
Consumers are justifiably frustrated with “paper towel performance failure”—towels that disintegrate during a tough scrub or leave a trail of lint on glass.
This frustration is compounded by “market obfuscation” tactics like “Double Rolls,” “Family Rolls,” and “Tear-A-Square” formats, which make direct price comparison nearly impossible. This protocol is the antidote.
It is a 5-step, scientific experiment that provides a “Cost-per-Performance-Point” (CPPP) analysis to find the brand with the best performance for the lowest cost.
This article will guide you step-by-step through a 3-part Paper Towel Performance Test, show you how to log and analyze the data, and teach you to use the CPPP formula to find the true best value.
Why Your “Paper Towel Performance Test” Must Account for Engineering Trade-offs
Your Paper Towel Performance Test must account for the “Engineering Trade-offs” because manufacturers must choose between Absorbency, Strength, and Softness; a “10” in one is often a “4” in another.
A paper towel that fails you is likely a mismatch between your needs and the product’s built-in compromises. This protocol finds the brand with the best compromise for you.
Example: The “Engineering Trade-off”
How “Strength” Creates a Trade-off
“Strength” creates a trade-off because the chemical binders that create high Wet Strength often result in a towel that is less soft and less absorbent.
Water is specifically engineered to dissolve the natural hydrogen bonds in paper. Wet Strength is an artificial property added by chemicals. High-Strength Towels (e.g., Brawny, Sparkle) use long fibers and chemical binders (e.g., PAE resin) to create waterproof covalent bonds. This results in a stiffer, less soft towel with reduced porosity (empty space for water).
How “Absorbency” Creates a Trade-off
“Absorbency” creates a trade-off because the premium TAD manufacturing process required for high absorbency (i.e., “empty space”) results in a higher price.
True absorbency is a function of Porosity—the amount of empty space available to store liquid. Premium TAD Towels (e.g., Bounty) are “Through-Air-Dried” on a 3D mold, creating a bulky, porous, “empty” structure to hold liquid. This results in high absorbency but often a higher price than standard LDC (Light-Dry-Crepe) towels.
How “Softness” Creates a Trade-off
“Softness” creates a trade-off because the short, fine fibers used to create a cloth-like feel are prone to “Failed Inter-Fiber Bonding,” resulting in high lint.
This “Failed Inter-Fiber Bonding” means the towel disintegrates more easily when scrubbed, leaving fiber debris and streaks behind. Premium “Soft” Towels (e.g., Viva) use short, refined fibers to create a cloth-like texture. This results in a very low-lint, soft feel but often sacrifices Wet Strength and increases the price.
The 5-Step “Paper Towel Performance Test” Protocol
The 5-Step “Paper Towel Performance Test” Protocol is a standardized operating procedure (SOP) to systematically gather objective data on Absorbency, Wet Strength, and Lint.
Standardize Your Materials
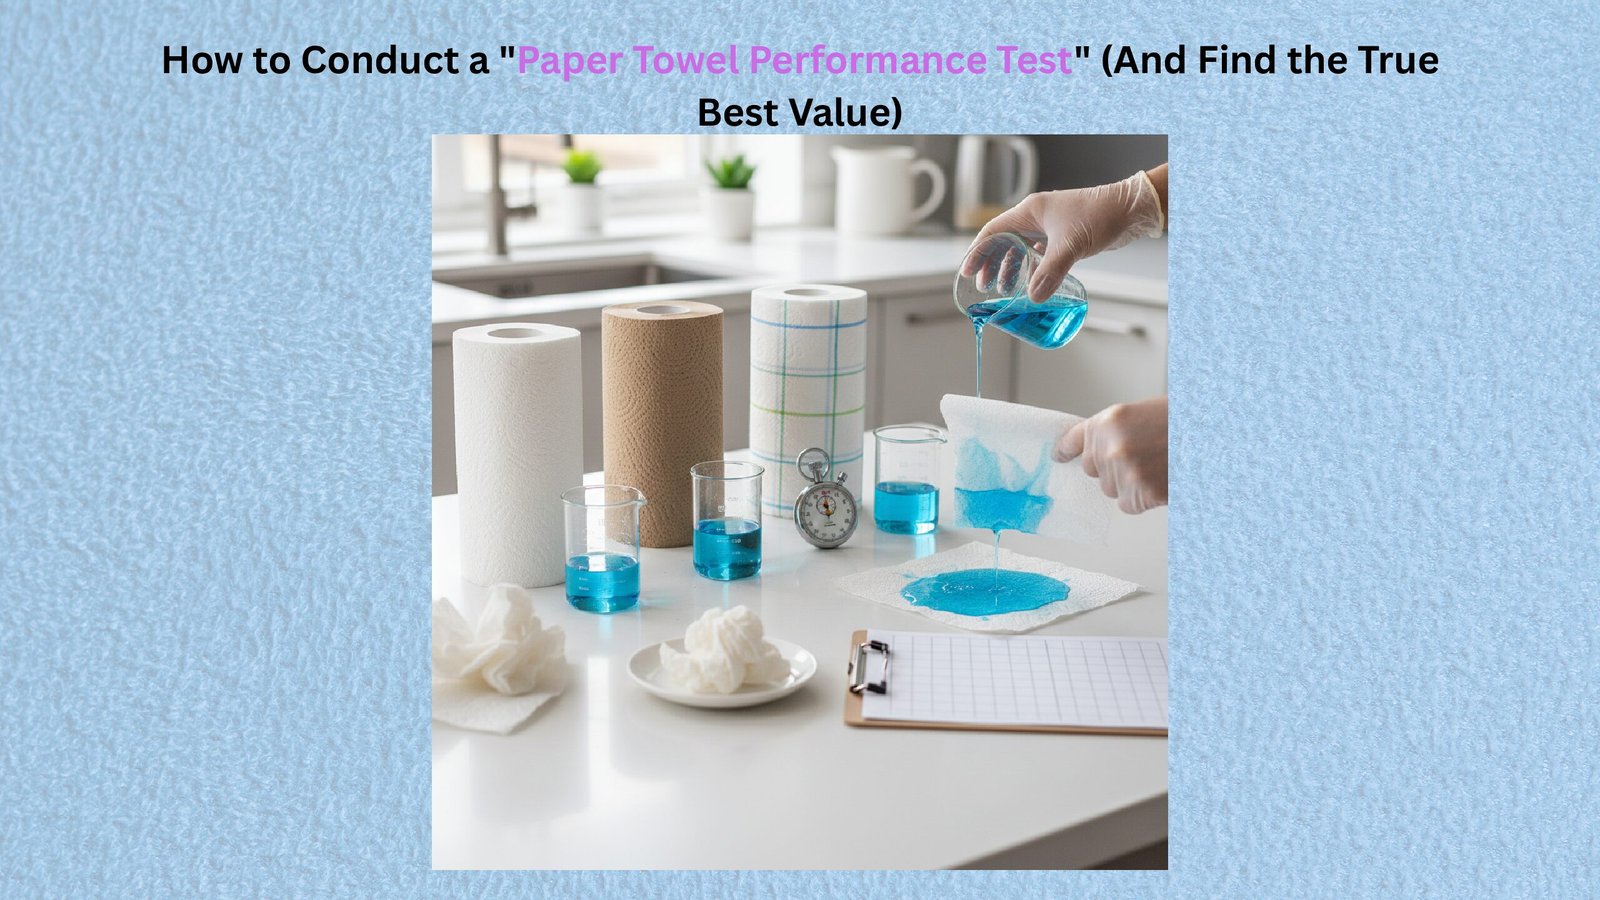
To begin, you will need a 1/4 cup (2 fl oz) liquid measure, a dark surface (like a black plate or mirror), a 10lb dumbbell or similar weight, a stopwatch, and a data-logging sheet. You will score each brand on a 1-5 scale for each of the 3 tests.Step 1: The “Absorbency Saturation” Test
The “Absorbency Saturation” Test quantifies a towel’s “Speed” and “Total Volume” by measuring its ability to absorb a standardized 2 fl oz (1/4 cup) spill.
Standardize Spill
Pour exactly 1/4 cup (2 fl oz) of water onto a non-porous countertop.Standardize Towel
Take one (1) single sheet of your test brand (e.g., Bounty).Measure Time-to-Absorb
Place the sheet over the spill and start a stopwatch. Do not wipe; let the towel absorb via Capillary Action.Record Time
Stop the timer when all water is absorbed. Record this time in your Data Log.Measure Hold
Lift the towel straight up and hold for 10 seconds. Observe if it drips.Assign Score (1-5)
Score 5 (Excellent): Absorbed < 5 sec; held all water, no drips.
Score 3 (Average): Absorbed in 5-10 sec; held water but felt saturated.
Score 1 (Poor): Took > 10 sec; dripped immediately; did not absorb the full spill.
Step 2: The “Wet Strength Integrity” Test
The “Wet Strength Integrity” Test quantifies a towel’s resistance to catastrophic failure (tearing) after full saturation, measuring the effectiveness of its PAE resin binders.
Standardize Saturation
Take one (1) single sheet and saturate it under a running faucet.Standardize Weight
Gently wring it out once. Lay it flat and place a 10lb dumbbell (or similar heavy, flat object) in the center.Measure Hold Time
Lift the towel by its four corners. Start a stopwatch.Record Failure Point
Hold the towel with the weight suspended for 30 seconds. Record if it holds, sags, or tears.Assign Score (1-5)
Score 5 (Excellent): Held the 10lb weight for 30 seconds with no tearing.
Score 3 (Average): Held the weight but showed significant sagging or minor tearing.
Score 1 (Poor): Could not lift the weight; tore immediately.
Step 3: The “Lint & Streak Residue” Test
The “Lint & Streak Residue” Test quantifies a towel’s “Surface Integrity” by revealing the amount of fiber debris (lint) and streaks it leaves on a high-contrast surface.
Standardize Surface
Use a clean, dark, reflective surface (a black mirror, glass stovetop, or black granite).Standardize Cleaner
Spray the surface once with a standard glass cleaner.Standardize Action
Take one (1) single sheet and wipe the surface dry, using firm, circular motions.Record Residue
Observe the surface under a bright light. Look for streaks, haze, and small fibers (lint).Assign Score (1-5)
Score 5 (Excellent): No streaks, no haze, zero lint. (Common for Viva).
Score 3 (Average): Minor streaks or haze, 1-2 visible lint fibers.
Score 1 (Poor): Obvious streaks, heavy haze, and significant lint debris. (Common for LDC towels).
Step 4: Data Analysis & The “Cost-per-Performance-Point” (CPPP) Formula
Data Analysis for your Paper Towel Performance Test culminates in calculating the “Cost-per-Performance-Point” (CPPP), an objective formula that reveals which brand provides the most performance for the lowest cost.
This is the “Aha!” moment where you move from subjective feelings to objective value.
Module 1: Log Your Data & Calculate Total Performance Score
Your first analysis task is to log your 1-5 scores for each brand into a central data table and sum them to find a “Total Performance Score.” This score (ranging from 3 to 15) represents the towel’s overall quality.
| Test Brand | Test 1: Absorbency Score (1-5) | Test 2: Wet Strength Score (1-5) | Test 3: Lint/Streak Score (1-5) | Total Performance Score (Sum of 3 Tests) |
|---|---|---|---|---|
| Example: Bounty | 5 | 5 | 3 | 13 |
| Example: Kirkland | 4 | 4 | 4 | 12 |
| Example: Sparkle | 2 | 3 | 2 | 7 |
| Example: Viva | 3 | 2 | 5 | 10 |
Example: Total Performance Score (Higher is Better)
Module 2: Calculate Price-per-Square-Foot (The “True Cost”)
Your second analysis task is to calculate the “Price-per-Square-Foot” (Sq. Ft.) to neutralize all “market obfuscation” like “Double” or “Mega” rolls. This is the only way to compare cost. Find the Total Sq. Ft. on the package label.
Formula: Total Package Price / Total Square Feet = Price-per-Square-Foot
Example: A $24.99 pack of Bounty with 852 total sq. ft.$24.99 / 852 sq. ft. = $0.029 per sq. ft.
Example: Average Price-per-Square-Foot
| Brand (2025 Market Avg.) | Average Price-per-Square-Foot |
|---|---|
| Bounty (Premium TAD) | $0.029 |
| Kirkland Signature (TAD) | $0.021 |
| Viva (Premium Soft) | $0.034 |
| Brawny (Strength-Focused) | $0.025 |
| Sparkle (Budget LDC) | $0.019 |
Module 3: Calculate the “Cost-per-Performance-Point” (CPPP)
Your final analysis task is to calculate the “Cost-per-Performance-Point” (CPPP) by dividing the “Price-per-Square-Foot” by the “Total Performance Score.” This formula reveals the true winner. A lower CPPP is better.
Formula: Price-per-Square-Foot / Total Performance Score = CPPP
Example (Bounty): $0.029 / 13 = $0.0022 CPPPExample (Kirkland): $0.021 / 12 = $0.0018 CPPP
Example: CPPP Analysis Table
| Test Brand | Price-per-Sq-Ft (Cost) | Total Performance Score (Quality) | CPPP (Cost / Quality) (Lower is Better Value) |
|---|---|---|---|
| Example: Bounty | $0.029 | 13 | $0.0022 |
| Example: Kirkland | $0.021 | 12 | $0.0018 (Best Value) |
| Example: Sparkle | $0.019 | 7 | $0.0027 |
| Example: Viva | $0.034 | 10 | $0.0034 |
Example: CPPP (True Value) (Lower is Better)
My Performance Diagnostic Hub
Use this tool to log your test sessions and analyze your findings over time.
Phase 1: Test Subject & Cost
Phase 2: Performance Scores (1-5)
Phase 3: Analyze
Protocol Disclaimer & Limitations
For Diagnostic Use Only. Not a Substitute for Lab Testing.
This protocol is an advanced diagnostic tool for personal, comparative analysis. The results are based on your specific execution of the tests (e.g., your water pressure, scrubbing force, “10lb” weight accuracy). Data, scores, and CPPP calculations derived from this protocol are for personal reference and should not be published or cited as equivalent to certified laboratory testing, which uses calibrated instrumentation (e.g., Mullen burst testers, absorbency-rate kinetic cells) under controlled atmospheric conditions.Advanced Context & Action Plan
The “Eco” Paradox & Compensatory Consumption
The “Eco” Paradox is the trap where consumers buy a “green” (e.g., recycled) paper towel but fall into “compensatory consumption,” ultimately using 3-4x as many sheets for the same spill.
Recycled towels often have poor Wet Strength and Absorbency, giving them a very low Total Performance Score. This forces you to use more towels, which negates the environmental benefit and dramatically increases your CPPP.
Visualizing The “Eco” Paradox (Cost-per-Task)
The “Compostability Myth”
The “Compostability Myth” is the flawed belief that paper towels can be composted. Most paper towels are saturated with PAE resins (plastics) for Wet Strength, which do not break down in a home compost bin.
Visualizing the “Compostability Myth”
Step 5: Your Final “Cost-per-Task” Action Plan
Your “Cost-per-Task” Action Plan operationalizes your CPPP data. Use this persistent tracker to manage your hypothesis and purchasing plan.
Protocol Complete
You have successfully moved beyond marketing and used objective data to find the true best value for your money.